TLP/YouGov 2024 Presidential Election Project—Wave 2
President Biden continues to hold a narrow lead over Donald Trump, but inflation concerns and doubts about his economic agenda weigh him down.

Roughly one year out from the 2024 election, the contours of the presidential contest appear to be settling in based on emerging public opinion data. A hypothetical matchup between likely nominees Joe Biden and Donald Trump shows a very close race nationally in many polls, including our own, although these results are mostly notional at this stage and less important than other substantive concerns raised by voters.
Chief among these concerns is the state of the American economy—and particularly, the ongoing challenge of persistent inflation on household finances.
The second wave of The Liberal Patriot/YouGov 2024 presidential election project was recently completed in early September, including interviews with more than 3000 registered voters1. The core focus of this wave of research is the domestic economy.
The Liberal Patriot will release the results in a series of posts over the next two weeks and the full data can be found here.
Initial findings include:
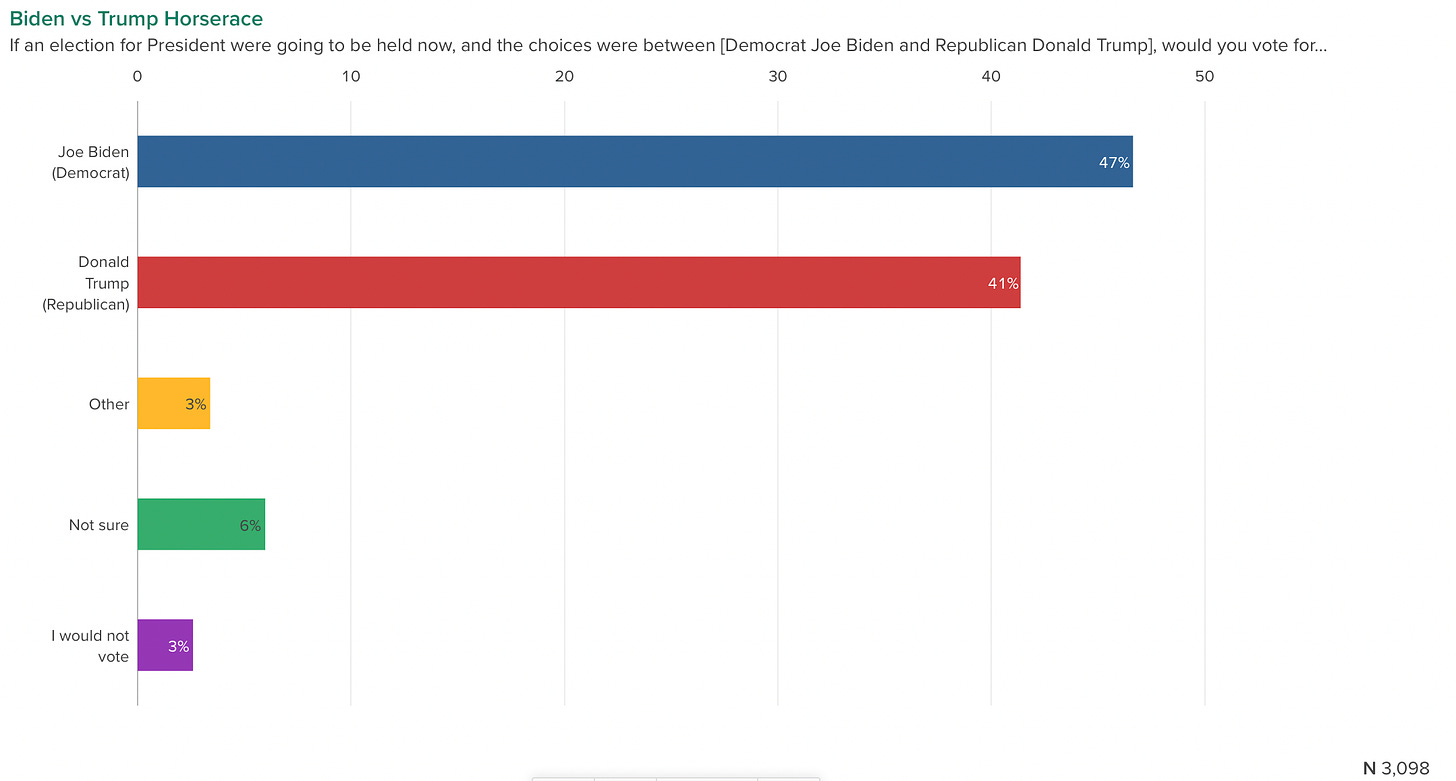
President Biden maintains a small lead over likely Republican nominee Donald Trump. Our first wave of research released earlier this summer showed Biden with a 6-point lead over Trump, a result that is essentially unchanged in our September polling. Currently, 47 percent of registered voters say they would choose Biden if the election were held today compared to 41 percent who would choose Trump; 9 percent would choose someone else or are unsure and 3 percent say they would not vote.
When undecided voters are pushed to make a choice in a follow up question, the margin shifts to 52 percent to 47 percent, Biden over Trump, with 1 percent remaining undecided. Examining partisan support, more than nine in ten Democrats would currently vote for Biden and slightly less than nine in ten Republicans would vote for Trump. Strict independents (excluding partisan leaners) currently break for Trump by a 37 percent to 24 percent margin with nearly 30 percent undecided or in favor of someone else.
Looking at age breaks, Biden leads Trump substantially among younger voters ages 18-29 (+34) and ages 30-44 (+19). In contrast, Trump leads Biden narrowly among all three older age groups: ages 45-54 (+4), ages 55-64 (+5), and ages 65 or older (+10). On education splits, Biden leads Trump among all college educated voters (+21) while Trump leads Biden narrowly among all non-college educated voters (+5). Trump receives 15 percent of the black vote and 24 percent of the Hispanic vote in the current wave.
In terms of other potential head-to-heads, President Biden defeats Gov. Ron DeSantis by a 46 percent to 37 percent margin with 14 percent undecided or for someone else, and he beats both Vivek Ramaswamy (46 percent to 31 percent) and Nikki Haley (45 percent to 32 percent) by decent margins.
Senator Joe Manchin receives only 2 percent support nationally as a hypothetical “No Labels” presidential candidate. In wave 2 of the project, we explored additional presidential matchups including the potential effect of No Labels—the centrist organization seeking ballot access in numerous states ahead of a possible run to be determined early in 2024.
Despite recent controversies and criticisms about No Labels being a spoiler for Biden, our polling finds very marginal support nationally for a hypothetical No Labels line headed by Senator Joe Manchin of West Virginia. Manchin has been widely discussed as a potential No Labels candidate, but he has not yet said he will run for president and No Labels has not committed to nominating him should he run.
As seen in the right hand column of the table below, showing the overall results, Manchin receives only 2 percent of the total national vote in a three-way matchup, with Biden’s lead over Trump narrowing to 45 percent to 42 percent, and 8 percent unsure or for someone else and 2 percent not voting.
Interestingly, a possible Manchin candidacy would draw an equal 1 percent from existing Biden and Trump voters as seen on the left side of the table above showing how initial horse race voters in the poll would break out in a potential three-way race.
Notably, only 3 percent of voters who are undecided in the initial two-way race, and 13 percent of voters who choose someone else, say they would back Manchin in a possible three-way race. Among the initial “other” voters, nearly six in ten would continue to support another candidate. Likewise, only 3 percent of self-identified moderate voters in this poll would back a Manchin/No Labels candidacy—not exactly a ringing endorsement from its targeted ideological base.
Combined, these results suggest that No Labels may be less of a threat to the incumbent Biden than other third-party candidates such as Cornel West of the Green Party or perhaps Robert F. Kennedy, Jr., running as a Libertarian or independent—something that will be explored in future research.
Again, these are speculative results for consideration and analysis. The real impact of any third-party run from No Labels, or any other party, will almost certainly matter most in key battleground states and not at the national level.
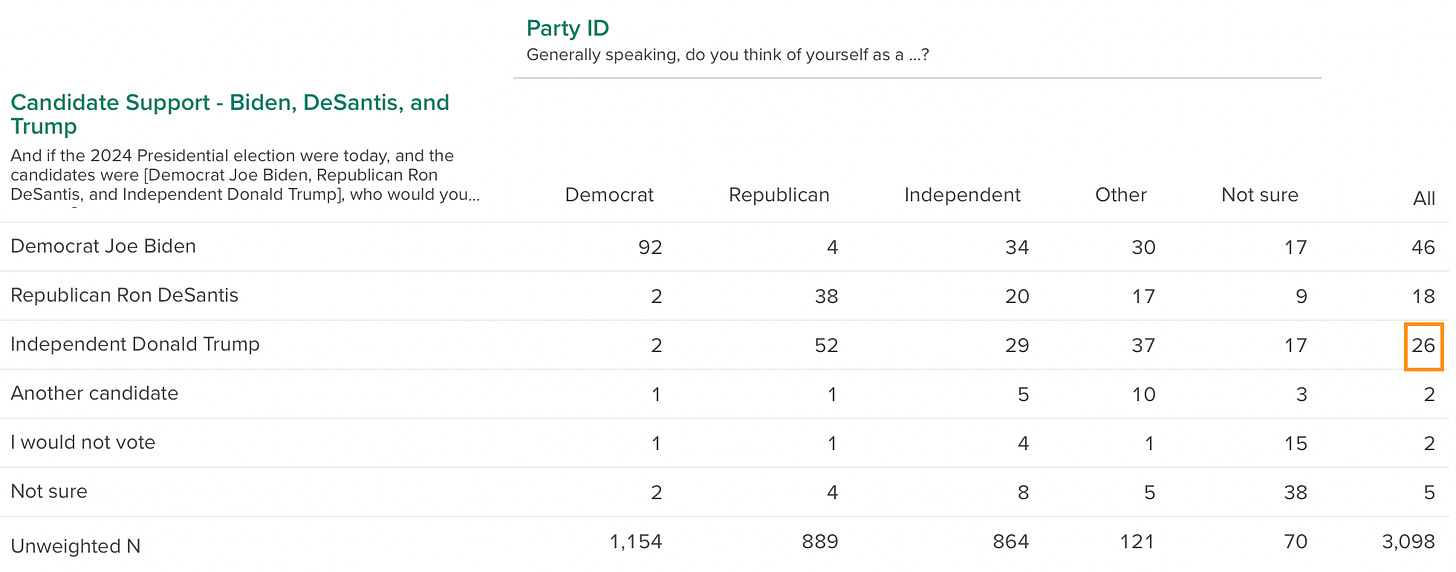
More than half of self-identified Republicans would buck the party line to vote for Donald Trump as an independent candidate. In a different hypothetical matchup, the poll explored the potential impact of Donald Trump not getting the Republican nomination and instead choosing to run as an independent against Biden and a potential Republican nominee, Gov. Ron DeSantis.
As seen below, in this scenario, Trump would pull more than one quarter of the total vote with a full 52 percent of self-identified Republicans saying they would vote for him as an independent compared to 38 percent who would vote for DeSantis. Needless to say, a potential Trump independent line would be highly disruptive to the national hopes of the Republican Party—and in many states.
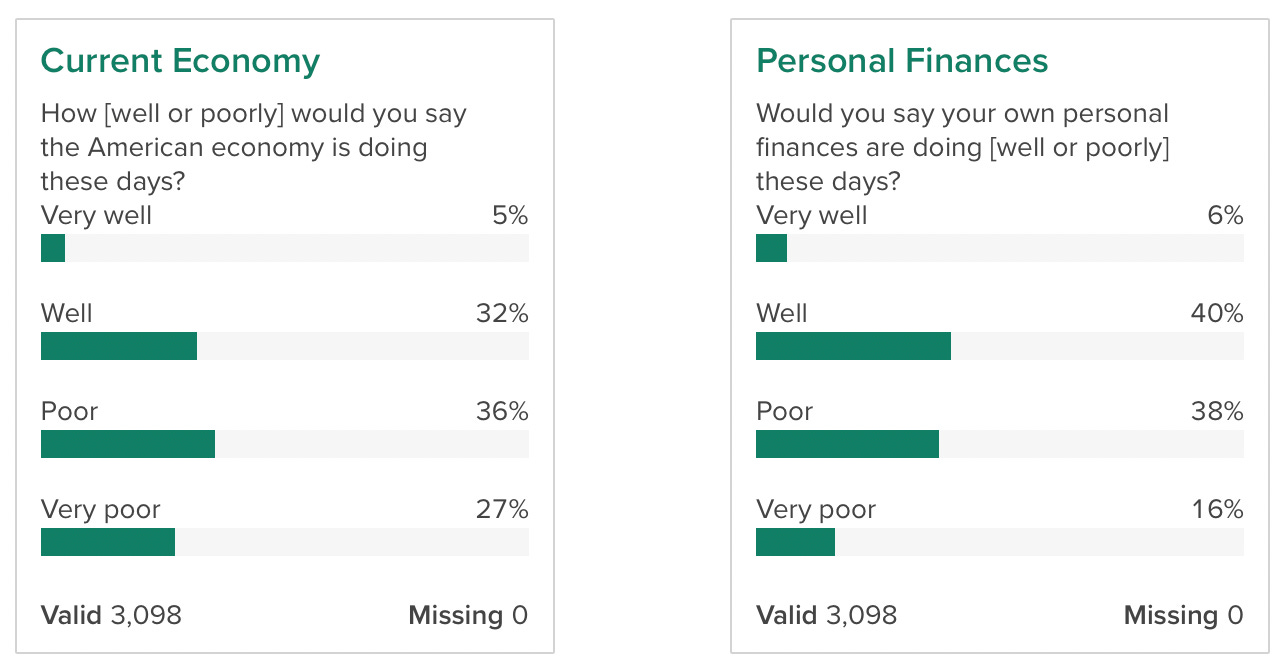
Nearly two-thirds of voters say the American economy is doing poorly these days, and more than half feel that way about their own personal finances. Asked to rate how the overall economy is doing these days, 63 percent of voters say the economy is poor (36 percent) or very poor (27 percent).
Partisan splits about the health of the overall economy are stark. More than six in ten Democrats say the economy is doing well versus nearly nine in ten Republicans who believe it is doing poorly. Independents track much more with Republicans on the overall state of the economy with more than seven in ten saying it is in poor shape.
Attitudes on the personal financial side are slightly better in aggregate, with notable differences by education level—for example, 56 percent of college educated voters say their personal finances are doing well these days compared to only 40 percent of non-college educated voters.
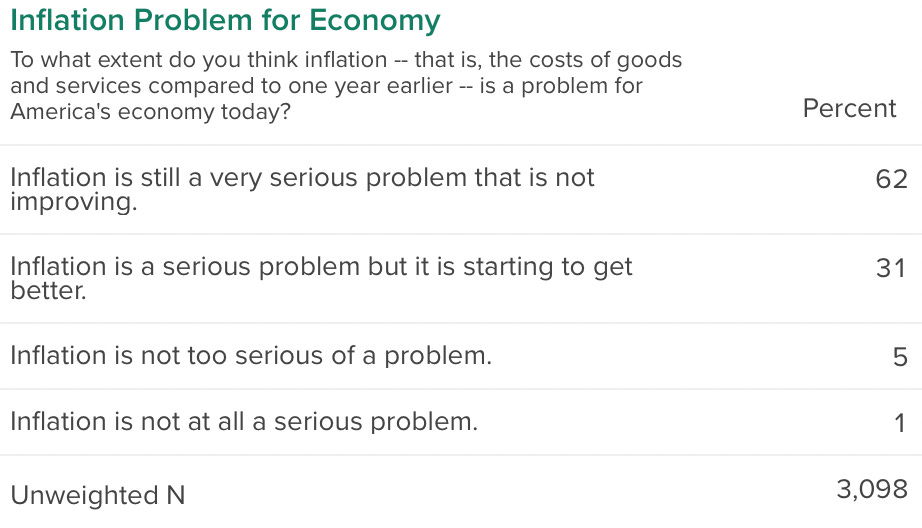
More than six in ten voters believe that inflation remains a very serious problem that is not improving. In terms of issues that will likely affect the eventual outcome of the 2024 presidential election, none is more important than inflation. And Americans remain very concerned about the effect of persistent inflation on the overall economy.
As seen in the table below, given four choices about the importance of inflation, 62 percent of voters believe that “inflation is still a very serious problem that is not improving.” Around three in ten voters believe inflation is a serious problem that is starting to get better, and a scant 6 percent of voters feel inflation is not a serious problem.
In terms of education splits, almost seven in ten non-college educated voters believe inflation is a very serious problem that is not improving along with 54 percent of college educated ones.
Only well-to-do voters appear to hold more positive views on inflation. Although two-thirds or more of lower-income Americans—and around six in ten middle- and upper middle-income voters—say inflation is a very serious problem that is not improving, just 45 percent of those with more than $150,000 in annual household income see it that way with another 43 percent in this category saying it is a problem that is starting to get better.
In partisan terms, only 35 percent of Democrats believe inflation is a very serious problem that is not improving with most Democrats saying it’s a problem that is starting to get better. In contrast, nearly nine in ten Republicans and seven in ten independents say inflation is a very serious problem that is not improving.
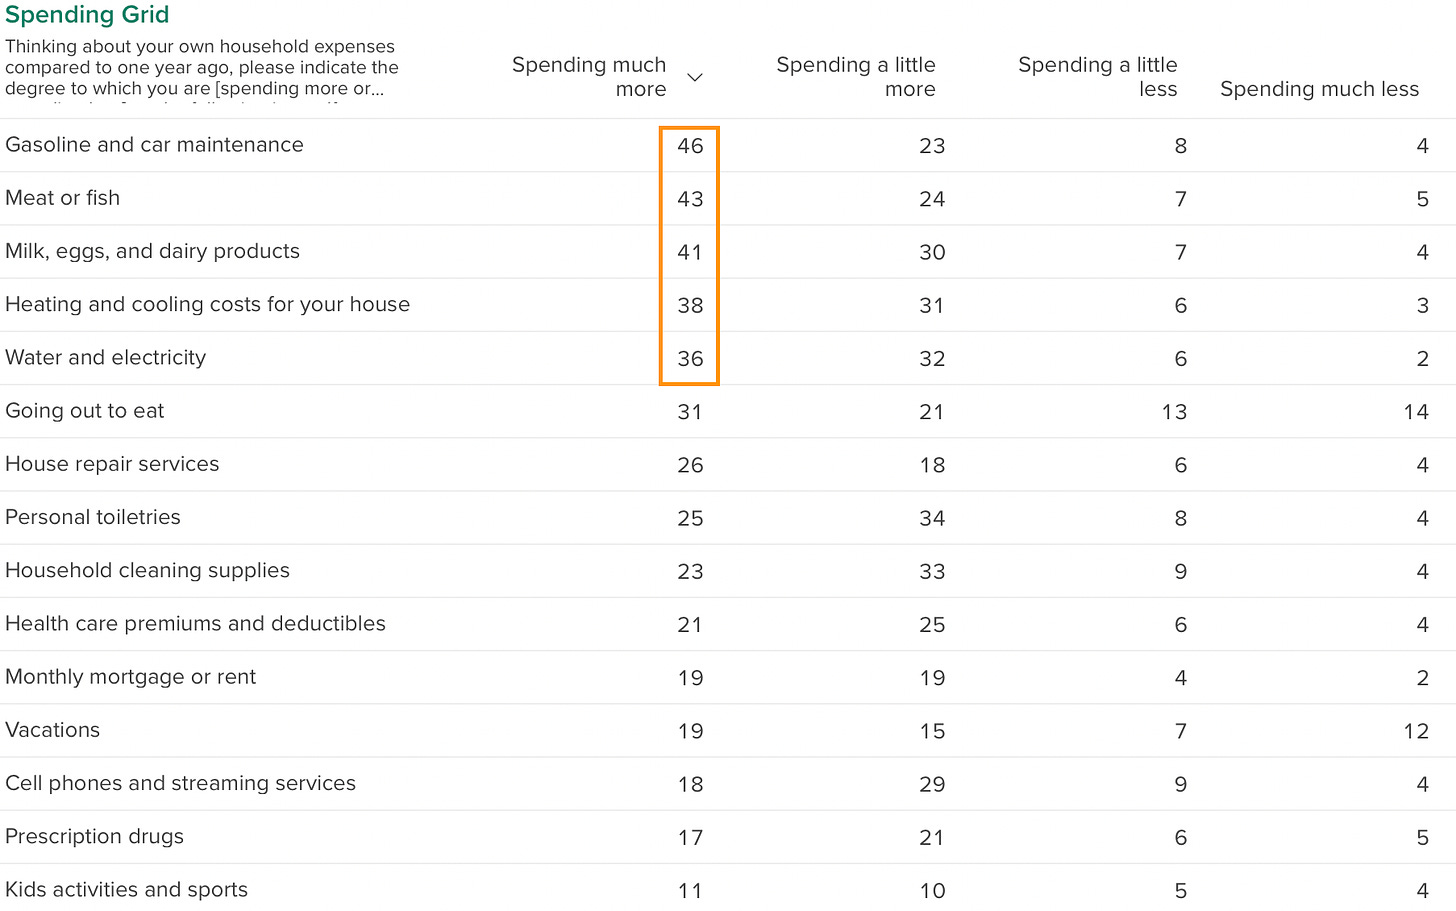
Voters are spending a lot more money on key household goods and services. The wave 2 survey presented respondents with a long list of items and asked them whether in the past year they were spending much more, a little more, a little less, or much less on each one, or if their spending hasn’t really changed or they don’t purchase that item.
Although increased or decreased spending in each area doesn’t necessarily indicate inflationary pressures (and might include a person choosing to spend more or less on that item anyway), this measure does offer insight into key goods and services that may be influencing family budgets—and likely, perceptions about the overall economy and personal finances.
As seen in the table below, anywhere from 36 to 46 percent of voters overall say they are spending much more on utilities and energy as well as on food, gas, and car maintenance.
Around one quarter or more of American voters report spending much more in the past year on things like eating out or house repair services and cleaning supplies. Interestingly, given higher interest rates, only one fifth or less of Americans report spending much more on big-ticket items like mortgages or rent, as well as on health care premiums, prescription drugs, and emerging family budget items like cell phones, streaming services, and activities for kids.
In terms of the potential political impact of higher costs, it is reasonable to assume that voters will continue to evaluate leaders’ progress (or inaction) on inflation based mainly on how they feel about the personal expenditures they confront daily—groceries, household goods, utilities/energy, gas, and cars.
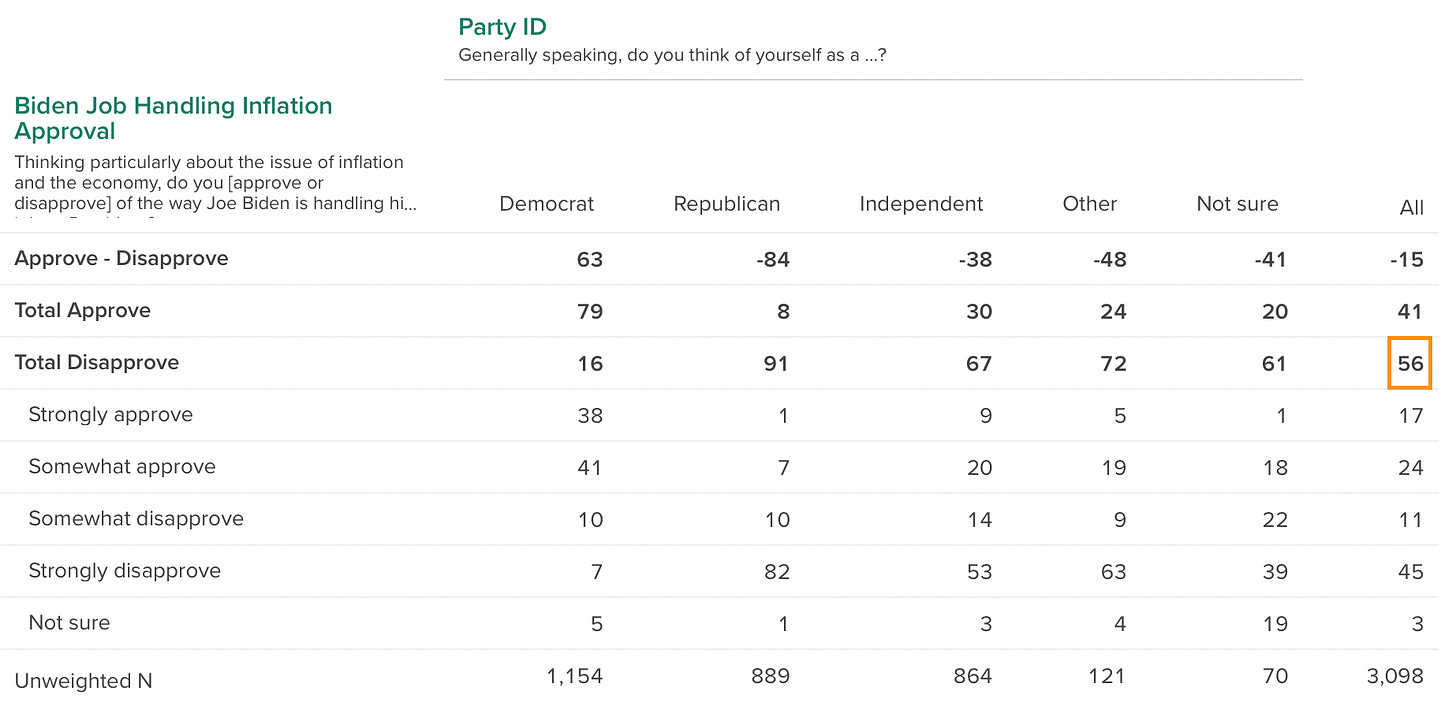
Nearly six in ten voters currently disapprove of the way President Biden is handling issues of inflation and the economy. Not surprisingly given some of these findings, a large percentage of American voters disapprove of President Biden’s handling of inflation and the economy.
Overall, 56 percent of voters disapprove of Biden on inflation and the economy, including 45 percent who strongly disapprove of him on these measures. As seen above, the partisan splits are striking: nearly 80 percent of Democrats approve of Biden’s handling of inflation and the economy compared to only 8 percent of Republicans and 30 percent of all independents (including leaners).
As will be seen in upcoming columns, Biden’s troubles on the economy extend beyond the issue of inflation.
Despite holding a slight lead in the horse race, the president has a lot of work to do to convince voters that “Bidenomics” is something positive for them and the economy overall—and that it is better than the economic stewardship and approach of his predecessor and likely opponent.
This survey is based on 3,098 interviews conducted by YouGov on the internet of registered voters. The sample was weighted according to gender, age, race/ethnicity, education, and US Census region based on voter registration lists, the U.S. Census American Community Survey, and the U.S. Census Current Population Survey, as well as 2020 Presidential vote. Respondents were selected from YouGov to be representative of registered voters. The weights range from 0.34 to 2.7 with a mean of 1 and a standard deviation of 0.37. The margin of error (a 95% confidence interval) for a sample percentage p based upon the sample is approximately 1.9%. It is calculated using the formula:
where CV is the coefficient of variation of the sample weights and n is the sample size used to compute the proportion. This is a measure of sampling error (the average of all estimates obtained using the same sample selection and weighting procedures repeatedly). The sample estimate should differ from its expected value by less than margin of error in 95 percent of all samples. It does not reflect non-sampling errors, including potential selection bias in panel participation or in response to a particular survey.


