TLP's 2024 Swing-State Project: Wisconsin (Part Two)
Examining Wisconsin's demographics—and how they shape the state's elections

[Editor’s note: Part one of the Wisconsin analysis is here.]
Population and Demographic Characteristics
Between 2010 and 2020, Wisconsin’s population grew at a rate of 3.6 percent. The population is heavily concentrated in its southern half, especially around the major metro areas of Milwaukee and Madison. In fact, the largest jump in population by far came in Dane County, which grew by a whopping 15 percent. By contrast, Milwaukee took a significant hit, with a net loss of 8,246 residents—the most of any county in the state—driven entirely by an exodus of residents from Milwaukee City.
Demographically, Wisconsin remains fairly racially homogeneous, with white residents making up 86.3 percent of the state’s citizen voting-age population. However, there is also a substantial black population, which is largely concentrated around Milwaukee. Additionally, one county—Menominee—is home to the Menominee tribe, and Native Americans thus make up a massive 85.6 percent of the county’s population.
Voting Trends by Demographic Group
For this section, we used a variety of sources. When analyzing voting trends broken down by race, sex, age, and education, we used data from the States of Change project. For partisan ID, we used AP VoteCast survey data, which gauged vote choice by voters’ self-identified partisanship. Finally, we rely on the traditional exit polls—the only real source of data on this subject—to examine union households and show how their vote preference and share have changed over time.
Race, Education, and Sex
Mirroring the state’s overall population, the Wisconsin electorate is overwhelmingly white, making up 88 percent of the vote share in 2020. These voters constitute a significant share of each party’s coalition, though this is much truer for Republicans—97 percent of whose voters are white—than for Democrats, for whom that figure is closer to 83 percent. White Wisconsinites are also among the most engaged voters, with over 70 percent turning out in both 2016 and 2020. Unsurprisingly, this bloc votes Republican more than any other racial demographic group, backing Trump by six points in 2020.
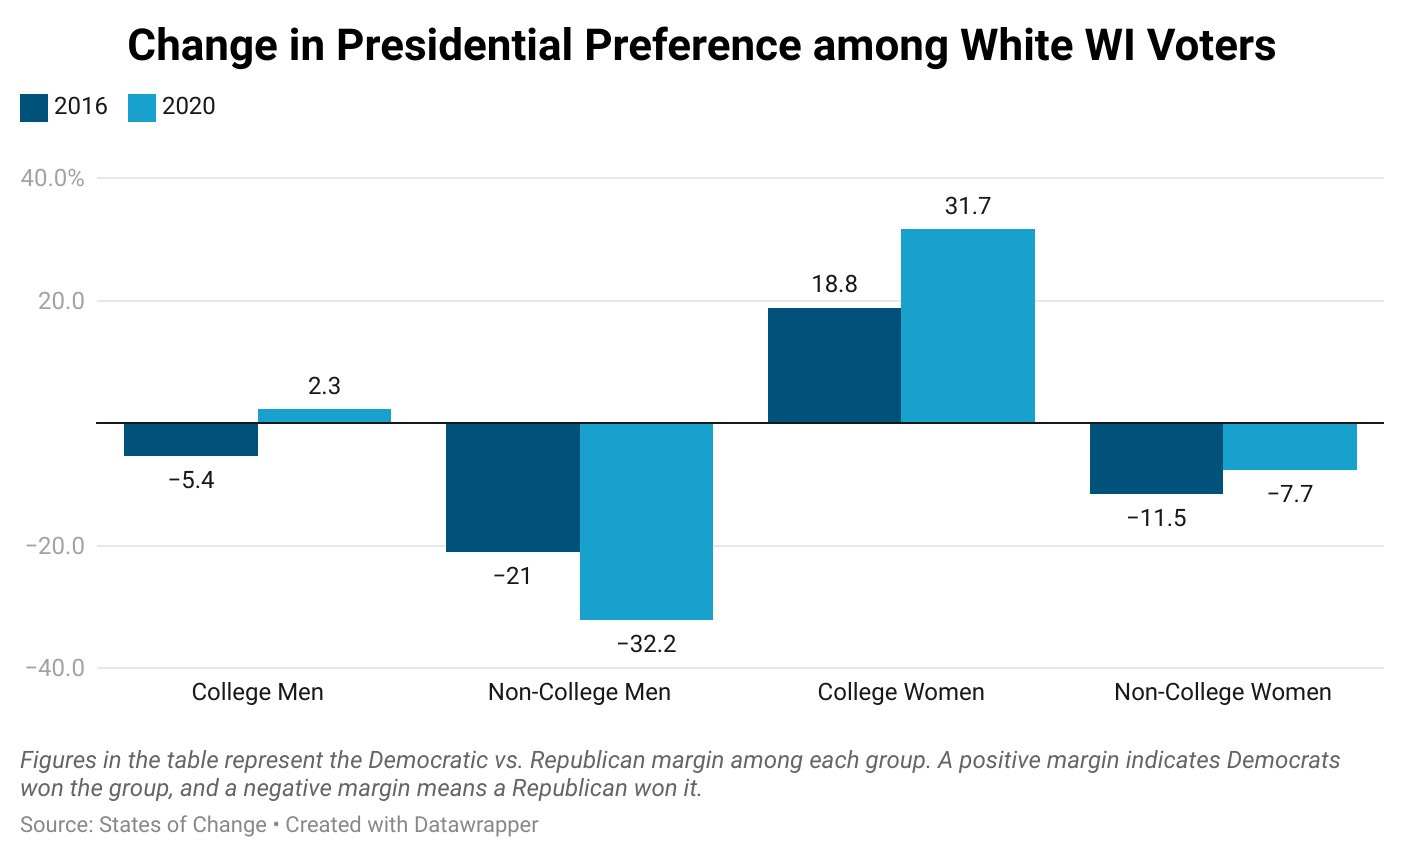
However, there is a significant—and growing—partisan split among whites along education lines. White non-college voters are a very Republican-leaning group, supporting Trump by 16.1 points in 2016 and 19.7 points in 2020. But college-educated white voters went from backing Clinton by 7.7 points to breaking for Biden by 18.3, voting nearly as Democratic as their non-college-educated counterparts voted Republican that cycle. Notably, this leftward drift among college degree-holders was disproportionately drive by women, as evidenced below.
Non-college white voters made up a healthy majority (around 57 percent) of the electorate in 2020, barely budging from 2016 and a sign of this group’s enduring statewide electoral influence. By contrast, whites with a degree are only about one-third of the electorate. This means that Democrats must win a meaningful share of the non-college bloc to be competitive in the state. In 2020, a plurality (45.2 percent) of their coalition was non-college whites who were not college-educated, down from 48.5 percent in 2016. The party cannot afford to slip much further with these voters given the relatively small share of the electorate made up by college-educated whites and non-white voters.
Among the remainder of the electorate, black voters composed four percent of the vote share in 2020, down from 4.5 percent in 2016. Meanwhile, the Hispanic and Asian slices of the electorate grew slightly: by 1.2 points and 0.6 points, respectively. While these groups all lean Democratic, their support levels vary widely. Black Wisconsinites are among the most loyal Democratic constituencies, backing Biden by 81.3 points. Hispanic (+35.1) and Asian (+38.6) voters supported Biden at roughly the same rates. However, these groups’ trendlines have varied. Between 2016 and 2020, black voters swung rightward the most, voting more Republican by 9.4 points. Hispanics also shifted right by 6.3 points. Asians, however, moved leftward by 9.4 points.
As with white voters, there are meaningful education gaps among racial minority groups. In 2016, non-college black and Hispanic voters were more Democratic-leaning than their college-educated peers, while Asian degree-holders were likelier to vote blue than those without a degree. By 2020, all three groups experienced substantial changes along educational lines. Black, non-college voters swung 10 points rightward, putting them on par with college-educated blacks. Hispanics with and without a college degree moved in opposite directions in 2020, with non-college Hispanics swinging rightward by 9.1 points and voting less Democratic (+34 points) than college degree-holders (+39 points), who moved 2.7 points to the left. And, both groups of Asian voters swung to the left by healthy margins.
Additionally, there are important gender gaps among black Wisconsinites. The gaps were substantial in 2016 and grew even wider in 2020. Black male Wisconsinites voted for Clinton by 85.3 points, but their support fell to 70.3 points by 2020 as fully 14.1 percent voted for Trump the second time around. Meanwhile, the drop-off among black women was far less severe, going from 95.2 points to 90.5 points.
Age
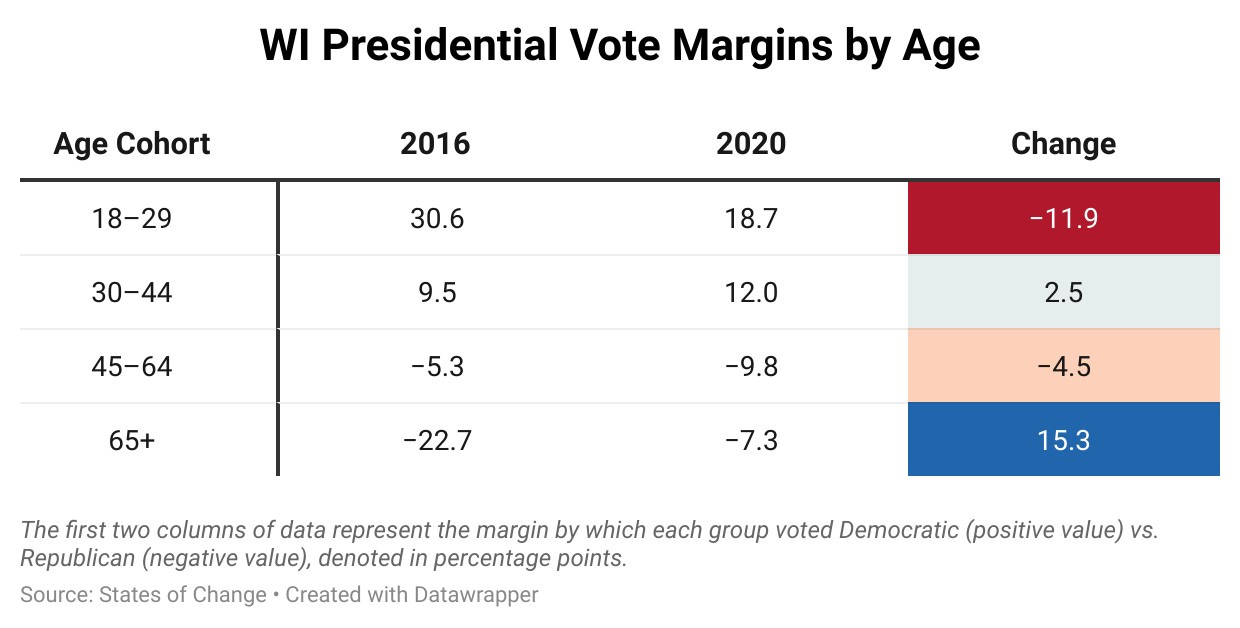
When broken down by age, the Wisconsin electorate generally reflects national trends: younger voters lean more Democratic and older voters lean more Republican. As is true elsewhere in the country, the youngest age cohort (18–29) in Wisconsin has constituted the smallest share of the electorate in the last two presidential elections and is by far the most underrepresented group, with their vote share among actual voters lagging their share of eligible voters by 5.6 points in 2016 and 3.4 points in 2020. They also turn out at the lowest rate of any age group: less than half (49.7 percent) voted in 2016, and while that jumped to 61.4 percent in 2020, it still lagged the next-closest group’s turnout rate by nearly 10 points. Young voters are also the most Democratic, but they swung rightward by nearly 12 points from 2016 (Clinton +30.6) to 2020 (Biden +18.7). This is a key constituency for Democrats, and clearly there is still room for the party to grow with them moving forward.
The next age group (30–44) is slightly less Democratic than the youngest voters but still supported Clinton and Biden by healthy margins—9.5 points and 12 points, respectively. Similar to voters aged 18–29, this group is slightly underrepresented in the electorate relative to its eligible pool of voters, but they do turn out at a higher rate, with upwards of 71 percent casting a ballot in 2020. This group also voted third-party at the highest rate in 2016, with 10 percent opting for a candidate other than Clinton or Trump.1
Voters aged 45–64 are more conservative, backing Trump in both elections and shifting rightward by 4.5 points in between them. These voters are also the largest age group in the electorate, representing between 34 and 39 percent of all votes cast in the last two presidential contests (no other group made up more than one-third of the vote share). Similarly, they have constituted a plurality of both parties’ coalitions, a sign of their influence in the state. They are more highly engaged than younger voters: at least three-quarters of this group turned out in both 2016 and 2020.
Finally, the oldest age bloc, seniors (65+), is a little harder to pin down. They still lean Republican overall, but they also swung by the most of any age group between 2016 and 2020—and they did so in favor of Biden. After breaking for Trump by an astounding 22.7 points the first time, they only backed him by 7.3 points against Biden—an overall shift of 15.3 points and likely a major reason why the state flipped back to Democrats. These voters are also among the most engaged, with the highest turnout rate of any age group in each of the previous two presidential elections.
One important fault line within each age group is sex—especially among younger voters. In 2016, both men and women aged 18–29 overwhelmingly supported Clinton by 27.8 points and 33.1 points, respectively. However, there was a significant split four years later, as young men in the state swung heavily to the right and backed Biden by just 8.5 points. Meanwhile, young women only moved rightward by 4.5 points, breaking for Biden by 28.5 points and widening the overall gender gap to 20 points.
Among voters aged 30–44, the gender gap has been even wider. In 2016, men in this age group narrowly backed Trump by 2.7 points while women supported Clinton by 20.4, constituting a gap of 23.1 points. In 2020, the men moved slightly rightward (Trump +5.8), but women moved even more leftward (Biden +28.6), bringing the male-female gap to 34.4 points.
To be sure, the youngest men also make up the smallest slice of the Wisconsin vote share (just 8.5 percent in 2020) and also had a lower turnout rate than any other group on the basis of age and sex—they were notably the only one in which a majority did not cast a ballot in 2016. While Biden flipped the state despite losing significant ground with them, this is still a traditionally Democratic-friendly cohort, and regaining lost ground with these voters could help the party offset losses elsewhere in the state moving forward.
Party ID
Wisconsin voters mostly identify with one of the two major parties. According to the AP VoteCast survey, a slight majority (51 percent) of the Wisconsin electorate was Republican or leaned Republican in the 2020 election while only 44 percent said they were Democrats or leaned Democratic. Importantly, though, Biden kept nearly all Democrats and Democratic leaners in the fold, winning fully 97 percent of them. Conversely, Trump won just 91 percent of Republicans and Republican leaners, with eight percent defecting to Biden. Moreover, the roughly five percent of the electorate that considered themselves true independents broke for Biden by 22 points, 58 percent to 36 percent. To win the state again in 2024, Biden will need to try to replicate this formula, including peeling away at least some Republican voters who may not support a Republican like Trump.
Union Household Status
Following Republicans’ concerted efforts to weaken unions in the state, membership rates have declined, sitting at a meager 7.1 percent as of 2022. Over time, this has taken a toll on union households and impacted their voting habits. As recently as 2012, Democrats were winning upwards of 65 percent support from union households. But just four years later, Hillary Clinton fared much worse, earning just 53 percent support from these voters.
Moreover, the dilution of union power in the state can be seen by waning influence in elections. Over just the past three presidential elections, their vote share dropped by six points (21 percent to 15 percent). All this has come at the expense of Democrats, who have lost an estimated 152,867 votes from these voters during that time. Still, these voters generally lean Democratic, and unions remain crucial organizing vehicles for the party.
They also dropped the most in 2020 in this regard, with just 2.1 percent picking a third-party candidate that cycle.


