Many Americans define themselves “middle class.” But what does that actually mean?
The Pew Research Center periodically asks Americans to say whether they belong to “the upper class, upper-middle class, middle class, lower-middle class, or lower class.” The answers over time have been consistent:
Two percent describe themselves as upper class.
Almost 20 percent say they belong to the upper-middle class (UMC).
Half say they’re middle class, or “core middle class” (CMC).
Almost 20 percent say they’re in the lower-middle class (LMC).
Eight percent categorize themselves as lower class.
In total, America’s self-described middle class amounts to 90 percent of the population. Because people tend to live in communities with people much like themselves, they may consider themselves about average. A family with an income of $225,000 living in a nice suburb might think of themselves as core middle class, for instance, and not as in the upper-middle class. Conversely, a family with a $40,000 income living in a low income area might think that they’re in the core middle class and not in the lower-middle class.
The word “class” presents an even bigger problem for many researchers, especially sociologists. This concept knits together multiple factors such as income, wealth, job type, education, prestige, and cultural sophistication. The most ambitious attempt to combine many factors is the Great British Class Survey, designed and data analyzed by Professors Mike Savage and Fiona Devine and their teams at the London School of Economics and the Universities of York and Manchester. They surveyed 161,000 people and asked numerous questions to get scores for economic capital (income, savings, house value), social capital (the number and status of people someone knows), and cultural capital (defined as the extent and nature of cultural interests and activities.)
In the end, they define 7 classes from low to high:
The precariat at 15 percent.
Emerging service workers at 19 percent.
The traditional working class at 14 percent.
New affluent workers at six percent.
Technical middle class at 15 percent.
Established middle class at 25 percent.
Elite at 16 percent.
This is a huge effort with lots of good data. But it remains a one-off study with several uncommon class titles.
Studying the divisions within the middle class requires an operational definition. Many researchers use current income to define class because it is closely related to all the factors associated with social class and because data on current income are readily available in many surveys with more than 100,000 participants.
The Pew Research Center and the OECD, for instance, define “middle income” as including those with incomes that are between 75 to 200 percent of median income. Because this approach is centered around median income each year, it can only show changes in inequality relative to the median—not growing real income across the population. Likewise, the Brookings Institution establishes the “middle class” as those in the middle three income quintiles each year; as a result, the size of the middle class always stays at 60 percent. This definition allows them to show how the middle class’s relationship to the top and bottom quintiles has changed over time, but not much else.
My approach avoids these problems. I stipulate five social classes based on incomes in 2014, when the Federal Poverty Line (FPL) for families of three was $20,000. Larger families had higher FPLs and singles and two person families had lower ones. Researchers around the world use a simple formula to convert families of different size into “family-of-three equivalent incomes (FTEs).”
Using this approach, my five classes are:
Poor and Near-Poor (PNP): 149 percent of the Federal Poverty Line and lower (an annual income of up to $29,999 in 2014).
Lower Middle Class (LMC): Between 150 and 249 percent of poverty ($30,000 to $49,999).
Core Middle Class (CMC): Between 250 and 499 percent of poverty ($50,000 to $99,999).
Upper Middle Class (UMC): Between 500 and 1,749 percent of poverty ($100,000 to $349,999).
Rich: Above 1,749 percent of poverty ($350,000 or greater).
It would of course be better to adjust for costs of living in different parts of the country, but these data aren’t universally available today or historically. However, this approach is sound overall as the underestimate of the number of UMC people in low-cost areas is offset by the overestimate of UMC people in high-cost areas of the country.
Using this measure, there was real growth in every rung of the economic ladder over the period from 1979 to 2019, with each ascending step having slightly higher percentage gain. That’s in line with a study by the Congressional Budget Office that found real income gains of more than 50 percent. But it’s out of step with the conventional wisdom that says real incomes declined, a widespread supposition based on the work of economists Thomas Piketty and Emmanuel Saez. What few people know, however, is that Piketty’s team later showed a 33 percent median real income gain when they employed a different method—indeed, in 2018 Saez said his team’s later study “provides better and more meaningful numbers.”
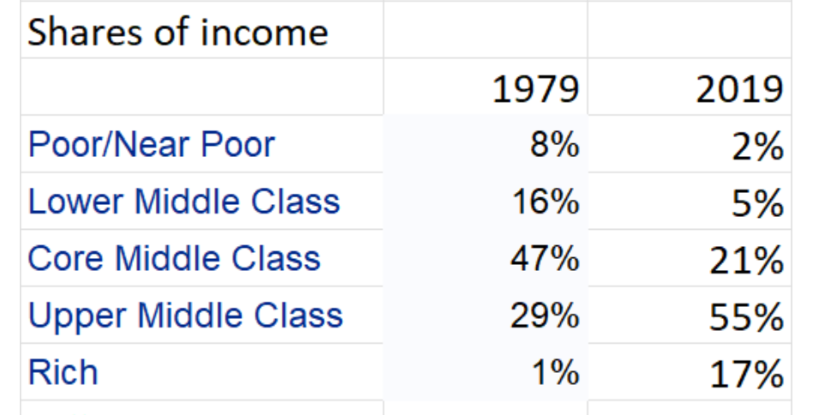
In brief, economic growth from 1979 to 2019 led more of the population to move up to higher social classes. As Table 1 shows, the bottom two categories—poor and near-poor plus lower middle class—went from a combined 49 percent to 29 percent. (The drop here is much greater than in other data because the sample of this study is based on independent adults—both spouses in a household, cohabitants, single heads of families, and singles.) The size of the CMC also declined, down from 39 percent to 31 percent over these years. These declines manifest themselves in a massive—and massively under covered—growth of the UMC, spiking from 13 percent in 1979 to 37 percent in 2019. The number of Rich also increased, but only from 0.2 percent to just under 3 percent. Another way to look at change over these years is to look at changes in the income shares of social classes, which takes into account the effect of rising inequality on the income shares of the Rich and the UMC.
By 2019, the three lowest classes—PNP, LMC and CMC—controlled just 28 percent of total income instead of the 71 percent they did in 1979. In contrast, by 2019 those in the UMC received over half of all income and the UMC/Rich combination controlled about 72 percent of all income.
Because the UMC and Rich have so much discretionary income, the bulk of advertising is aimed at these people. On television, luxury car ads abound: Audi, Acura, BMW, Lexus, Mercedes. Even ads for financial advisors now appear regularly. Style sections in newspapers regularly have stories on international travel and best restaurants to meet the interests of the exploding UMC. Finally, the rising housing prices and gentrification of inner-city centers have displaced many people, forcing many to move and others to become homeless.
That is why today the most consequential social divisions aren’t between the rich, the middle class and the poor—they are between different groups of the middle class. Those who hope to understand the changing politics of the middle class must take these new divisions into account.
Dr. Stephen J. Rose is a Research Professor at the George Washington Institute of Public Policy and a nationally-recognized labor economist who has been doing innovative research and writing about the interactions between formal education, training, career movements, incomes, and earnings for the last 45 years.


