Economically Distressed Places: How Big is the Problem?

Every place wants more good jobs. But where will more jobs have the greatest benefits? In other words, how many Americans live in places that suffer from job distress and lack sufficient access to good jobs?
As discussed previously, distressed places are of two types: distressed local labor markets and distressed neighborhoods. These different types require different policy solutions. Local labor markets, such as metro areas and rural commuting zones, are one or more counties that encompass most commuting flows. (Think of the Chicago metro area, a 14-county area in Illinois, Indiana, and Wisconsin.) Neighborhoods are much smaller areas that consist of contiguous census tracts with similar characteristics. (Within Chicago, think of Little Italy on the near West Side or Wrigleyville on the North Side.)
In local labor markets where a small share of the population is employed, there aren’t sufficient jobs within commuting range. Local job creation can help.
For neighborhoods with low employment rates, neighborhood job creation may not help as most Americans do not live and work in the same neighborhood. But neighborhood residents could see increases in employment rates through improved job access, broadly defined to include better transportation, more affordable child care, and better job training. Residents could then better access jobs throughout the local labor market.
Local Labor Markets
The evidence suggests that for local labor markets the highest benefits from job creation occur when employment rates are in the bottom 40 percent of all U.S. labor markets. In these distressed local labor markets, job creation can permanently boost the share of residents with a job and thereby also permanently boost earnings per capita. These earnings boosts are greater in percentage terms for lower-income residents. Local governments also benefit, both from greater tax revenue from the higher earnings and from smaller expenditures needed to address fewer local social problems.
For local labor markets whose employment rates are in the top 60 percent, by contrast, local job creation almost entirely fuels local population growth, with little effect on local employment rates. Property owners may benefit from higher property values, but benefits for local job seekers are few while renters suffer from higher rents. Local fiscal benefits are also lacking, as any gains in tax revenue are offset by the need to spend more on public services to keep up with a rising population.
The bottom 40 percent and top 60 percent of local labor markets differ significantly in local employment rates. The bottom 40 percent have an average employment rate for “prime-age” workers—those ages 25 to 54—more than six percentage points below that of the top 60 percent.
Even when the overall U.S. economy is said to be at full employment, distressed local labor markets still come up short—and more jobs in these labor markets would boost employment rates. Why not then use macroeconomic policies such as greater government spending or reduced interest rates to further boost overall national job creation? Because the resulting job creation throughout the country would likely increase inflation all else being equal. Creating good jobs for all without worsening inflation is easier if we target job creation on distressed local labor markets.
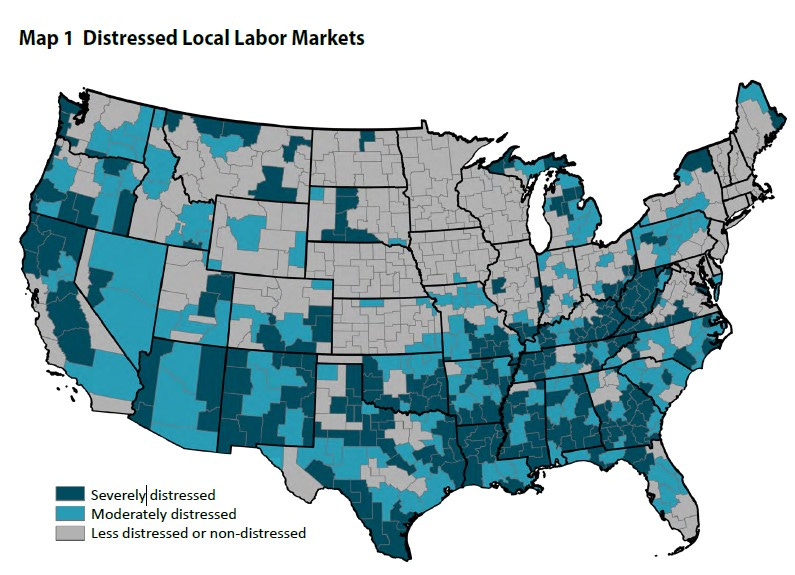
Map 1 shows the 40 percent of U.S. local labor markets with the lowest employment rates. The darker shades indicate the most severely distressed local labor markets, those in the bottom ten percent.

Distressed local labor markets cover much of the rural South and Appalachia. But they also include places such as Detroit and Flint, Michigan, Gary, Indiana, upstate New York, and much of the “inland” West Coast outside of the booming coastal cities.
What does this geographic distribution imply for different racial and ethnic groups? Overall, the racial and ethnic breakdown of distressed local labor markets roughly accords with the national population. In the most severely distressed local labor markets (bottom ten percent), the black population is 13 percent, the Hispanic population is 17 percent, and the white non-Hispanic population is 64 percent. (All figures for ages 16 and above.) Across the entire country, these percentages are similar: 12 percent black, 16 percent Hispanic, and 63 percent white non-Hispanic. In the bottom 40 percent of local labor markets, the shares are again similar: the black population is 12 percent, the Hispanic population is 20 percent, and the white non-Hispanic population is 60 percent.
Neighborhoods
For neighborhoods, a review of the research suggests that the greatest social benefits from greater employment come from helping the bottom 25 percent of all neighborhoods. These social benefits accrue not only to adult residents but also spill over to the neighborhood’s children, who are the most affected in the long run by a neighborhood’s character.
Employment rates across neighborhoods vary tremendously. Compared to the top 75 percent of neighborhoods nationally, the bottom 25 percent have a prime-age employment rate that averages over 15 percentage points lower. These bottom 25 percent are those neighborhoods whose prime-age employment rate is at least 3.3 percentage points below the overall average of the local labor market.
Using this relative 3.3 percentage point cutoff to define distressed neighborhoods, every state has at least 19 percent of their population living in such neighborhoods. These neighborhoods occur in both smaller local labor markets, and in big cities. For the ten percent of the U.S. population that lives in the 508 smallest local labor markets (out of the 764 total; see my 2022 research paper), 26 percent live in distressed neighborhoods. Interestingly, for the ten percent of the U.S. population that lives in the three largest local labor markets (New York City, Los Angeles, and Chicago), the share living in distressed neighborhoods is also 26 percent.
Indeed, distressed neighborhoods occur even in booming local labor markets. The Nashville area has 22 percent of its prime-age population in distressed neighborhoods, for instance; Dallas, 25 percent; and Miami, Seattle, and San Francisco, 24 percent each.
Black and Hispanic individuals are overrepresented in distressed neighborhoods—with population shares of 20 percent and 21 percent, respectively—but non-Hispanic white individuals still constitute the majority (52 percent) in these neighborhoods. U.S. residential racial segregation means that neighborhood disparities are a larger problems for Americans who are black or Hispanic, but neighborhood disparities are also a problem for many non-Hispanic white Americans.
How Much Will It Cost to Fix?
Another way to gauge the size of the distressed place problem is to ask how much it would cost to address it. The exact cost depends on how tightly the program is targeted on the most distressed places, how much of the employment rate gap is to be closed (and how quickly), and assumptions about how much it costs to create a job. In one report, I have estimated annual costs for a meaningful place-based program of $14 billion for distressed local labor markets and $5 billion for distressed neighborhoods, for a total national price tag of $19 billion per year. In a separate report with more ambitious goals in closing the employment rate gap, the cost was somewhat higher: $21 billion for distressed local labor markets and $9 billion for distressed neighborhoods, for $30 billion total. (By way of comparison, NASA received $25.3 billion from Congress in 2023.)
The bottom line is clear: under reasonable assumptions, the costs are substantial but also affordable. Because so many Americans live in distressed places, any meaningful solution to raise employment rates in distressed places must create millions of job opportunities. For example, if the cost per added job opportunity is $50,000 and the goal is to create jobs for two million people without them, the aggregate cost of achieving this goal would be $100 billion.
But these jobs need not be created all at once. Local economic development strategies take time to unfold. If one allows ten years to achieve the goal of two million jobs, the annual cost amounts to only $10 billion. While not trivial, this cost is only 0.2 percent of federal tax revenue, or 0.8 percent of state governments’ tax revenue. Both the federal government and individual state governments have the fiscal capacity to address the problems of distressed places in a meaningful way.
The problem of distressed places is big enough that it affects many Americans, in all regions of our country, in all types of communities, and in all ethnic groups. It is big enough that it cannot be solved on the cheap. But it is also manageable enough that meaningful improvements in the availability of good jobs can be made.
It just requires the political will to appropriately target job opportunities where they are most needed: on distressed places and their residents.
Timothy J. Bartik is a senior economist at the Upjohn Institute for Employment Research, a non-profit and non-partisan research organization in Kalamazoo, Michigan. His research focuses on state and local economic development policies and local labor markets. At the Upjohn Institute, Dr. Bartik co-directs the Institute’s research initiative on place-based policies.


